Julia package for visualising genomic data.
julia>]
pkg> add GenomicMapsThere are currently three plotting functions: drawgenome (see example below), drawplasmid (for small circular plasmids), and compareregions for showing synteny and sequence similarity between genomes or regions.
Hover over a gene to see annotations.

using GenomicAnnotations
using GenomicMaps


# You can add any kind of annotation that you want to display.
# Here, I add COG annotation:
function addcogs!(chr, filename)
    cogs = split.(readlines(filename), Ref('\t'))
    i = 1
    for gene in @genes(chr, :feature == "CDS")
        if gene.locus_tag == cogs[i][1]
            if occursin(r"\w", cogs[i][2])
                gene.cog = cogs[i][2]
            end
            i += 1
        end
    end
end


# Colour scheme for COG categories:
cogcolours = Dict("B"=>RGB{Float64}(1.0,0.630714,0.576563),
     "M"=>RGB{Float64}(0.756869,0.916499,0.965176),
     "I"=>RGB{Float64}(0.187839,0.54561,0.252343),
     "X"=>RGB{Float64}(0.540006,0.493982,0.813567),
     "Y"=>RGB{Float64}(0.0973617,0.285282,0.5329),
     "Z"=>RGB{Float64}(0.0418427,0.156645,0.341597),
     "L"=>RGB{Float64}(0.426131,0.0441442,0.0465628),
     "O"=>RGB{Float64}(0.518954,0.802339,0.930272),
     "F"=>RGB{Float64}(0.587882,0.865532,0.51112),
     "Q"=>RGB{Float64}(0.0,0.225356,0.101282),
     "D"=>RGB{Float64}(0.862653,0.958477,0.981395),
     "V"=>RGB{Float64}(0.188382,0.529206,0.795898),
     "U"=>RGB{Float64}(0.277786,0.635283,0.863472),
     "E"=>RGB{Float64}(0.711814,0.932724,0.629136),
     "T"=>RGB{Float64}(0.394211,0.72627,0.90426),
     "H"=>RGB{Float64}(0.32729,0.673206,0.326717),
     "P"=>RGB{Float64}(0.0232916,0.395886,0.180144),
     "G"=>RGB{Float64}(0.459895,0.779462,0.41097),
     "N"=>RGB{Float64}(0.641543,0.865092,0.94902),
     "K"=>RGB{Float64}(0.825431,0.118066,0.106858),
     "C"=>RGB{Float64}(0.835916,0.980813,0.770886),
     "R"=>RGB{Float64}(0.807625,0.787968,0.949453),
     "W"=>RGB{Float64}(0.137797,0.411028,0.686187),
     "A"=>RGB{Float64}(1.0,0.808314,0.771835),
     "S"=>RGB{Float64}(0.236943,0.0166779,0.407047),
     "J"=>RGB{Float64}(1.0,0.389569,0.336934))


# First download annotations for E. coli:
download("ftp://ftp.ncbi.nlm.nih.gov/genomes/all/GCA/000/005/845/GCA_000005845.2_ASM584v2/GCA_000005845.2_ASM584v2_genomic.gbff.gz", "ecoli.gbk.gz")

# Then read the annotations and add COGs:
chr = readgbk("ecoli.gbk.gz")[1]
addcogs!(chr, "ecoli_cogs.tsv")

# The output can be customised, see src/initialise.jl for all options. Here I
# provide a function that will be run on each gene to determine its colour:
colourby_cog = g -> unique(String.(split(get(g, :cog, ""), "")))
drawgenome(chr;
    outfile = "ecoli.svg",
    colourmap = cogcolours,
    colourfunction = colourby_cog,
    annotate = true,
nbreaks = 40)Some keywords that can be given to drawgenome to customise the output are:
genetextfunction: determines the text shown above each gene. Can be either aFunctionthat is executed for each gene, or aSymbol, in which case it defaults tog -> get(g, genetextfunction, "").colourfunction: a function that is executed for each gene to determine how to colour it. Currently only categorical colouring is supported, so continuous data has to be binned.colourmap: aDictmapping categories => colours. When using categorical data to colour genes, it can be left empty, but if continuous data (say, expression levels) are used it has to be set manually.defaultcolour: the default colour that is used for genes that do not have a specified colour incolourmap.nbreaks: anIntdetermining how many lines will be used to display the genome).drawingsize: determines the size of the output. Can be aStringsuch as"A4","A0landscape","1000x1000", or aTuple(e.g.(1000, 1000)).legend: can be:categorical,:continuous, or:none. ... and more (seesrc/initialise.jl)
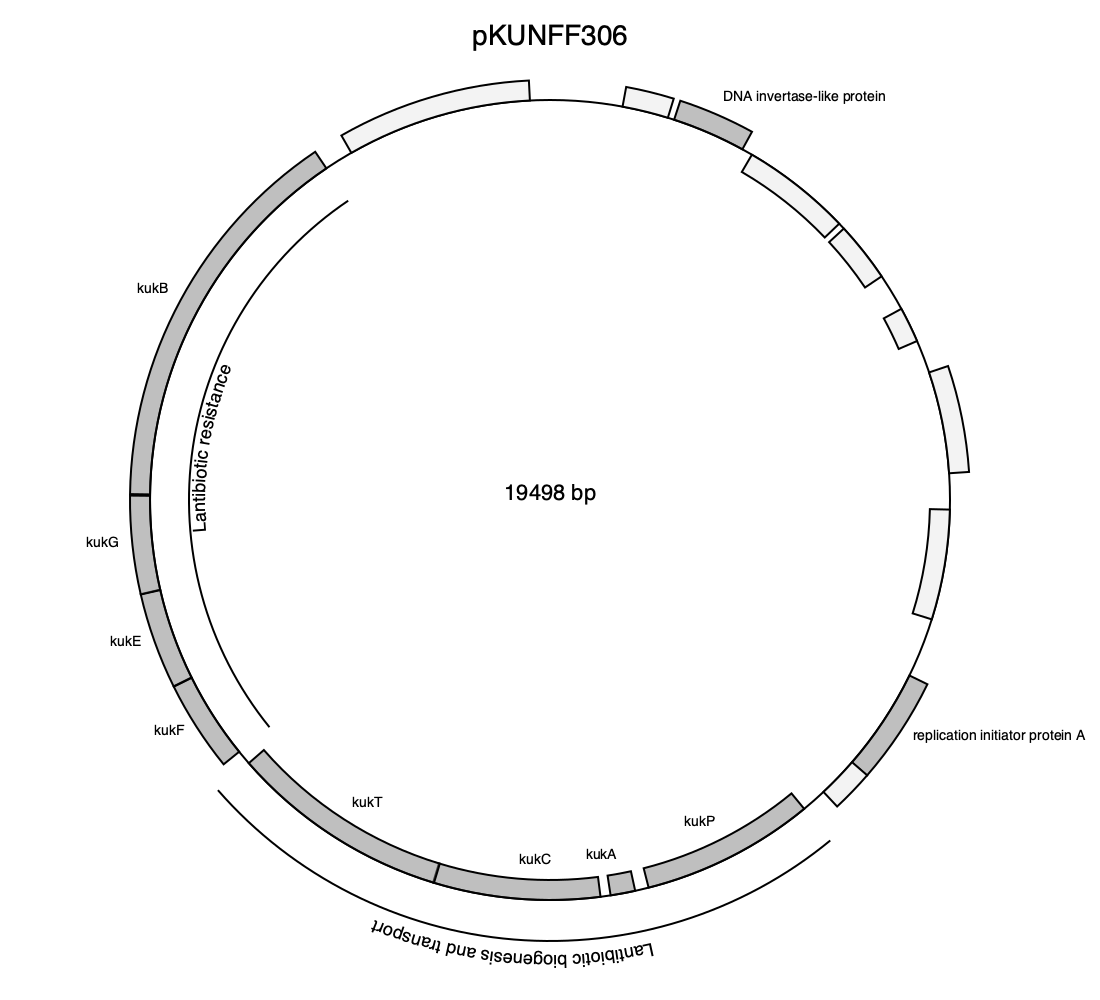
using GenomicAnnotations

download("https://eutils.ncbi.nlm.nih.gov/entrez/eutils/efetch.fcgi?db=nucleotide&id=1899346924&rettype=gb&retmode=text", "pKUNFF306.gbk")
chr = readgbk("pKUNFF306.gbk")[1]

### Create an array containing annotations
annotations = [get(gene, :gene, gene.product) for gene in @genes(chr, CDS)]
replace!(annotations, "hypothetical protein" => "")

### Create a Dict with Genes as keys and colors as values
cdict = Dict()
for gene in @genes(chr, CDS, :product != "hypothetical protein")
    cdict[gene.locus_tag] = RGBA(.5,.5,.5,.5)
end

### Create a Dict with gene cluster annotations
genegroups = Dict(14:17 => (text = "Lantibiotic resistance", placement = :inner),
                  10:13 => (text = "Lantibiotic biogenesis and transport", placement = :outer))

drawplasmid(chr; outfile = "pKUNFF306.png",
                 drawingsize = (1100, 1000),
                 annotations = annotations,
                 colors = cdict,
                 genegroups = genegroups,
                 title = "pKUNFF306")