![]()

This package defines a Plots recipe to implement the Stata command binscatter in Julia.
using DataFrames, Plots, Binscatters
binscatter(df::Union{DataFrame, GroupedDataFrame}, f::FormulaTerm, n = 20;
weights::Union{Symbol, Nothing} = nothing, seriestype::Symbol = :scatter, kwargs...)df: A DataFrame or a GroupedDataFramef: A formula created using@formula. The variable(s) in the left-hand side are plotted on the y-axis. The first variable in the right-hand side is plotted on the x-axis. Add other variables for controls.n: Number of bins (default to 20).
weights: A symbol indicating a variable to for weightsseriestype::scatter(default) only plots bins:linearfitplots bins with a regression line:scatterpathplots bins with a connecting line
kwargs...: Additional attributes fromPlots.
using DataFrames, Plots, Binscatters, RDatasets
df = dataset("datasets", "iris")You can use the typical options in Plot to customize the plot:
binscatter(df, @formula(SepalLength ~ SepalWidth), seriestype = :scatterpath, linecolor = :blue, markercolor = :blue)Length seems to be a decreasing function of with in the iris dataset
binscatter(df, @formula(SepalLength ~ SepalWidth), seriestype = :linearfit)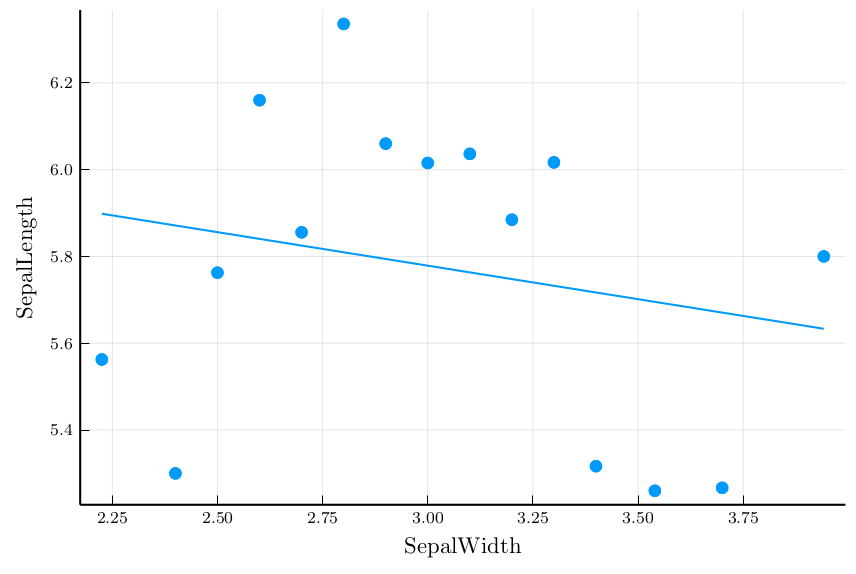
However, it is an increasing function within species. To show this, you can apply binscatter on a GroupedDataFrame
binscatter(groupby(df, :Species), @formula(SepalLength ~ SepalWidth), seriestype = :linearfit)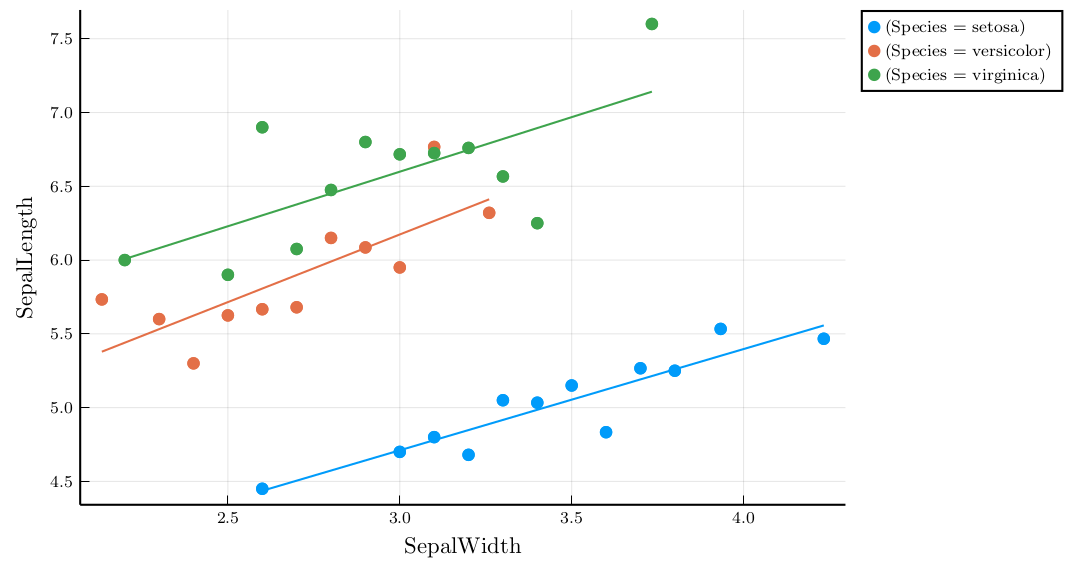
binscatter(df, @formula(SepalLength ~ SepalWidth + fe(Species)), seriestype = :linearfit)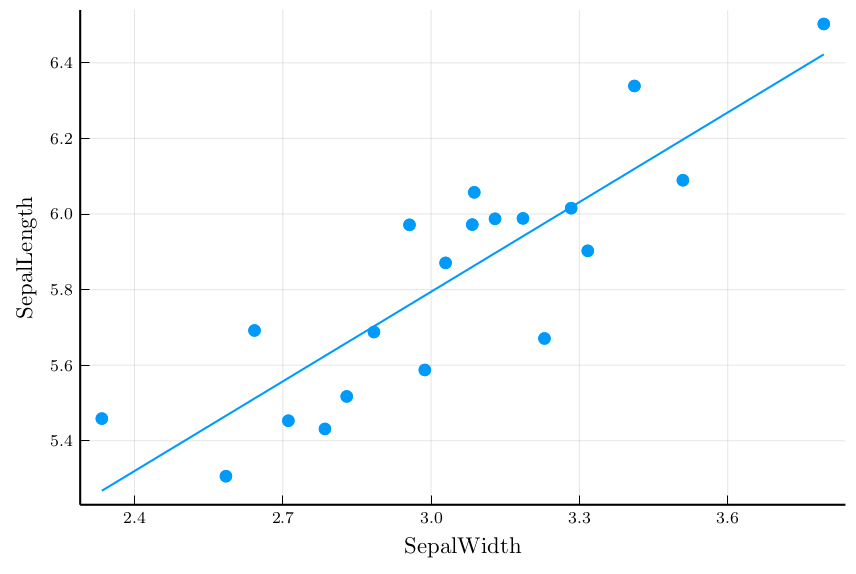
See more examples by typing ?binscatter in the REPL.
The package is registered in the General registry and so can be installed at the REPL with ] add Binscatter.