Kernel Density Estimation with product approximation using multiscale Gibbs sampling.
All code is implemented in native Julia, including plotting. The main focus of this module is the ability to take the product between multiple KDEs, and makes this module unique from other KDE implementations. This package also supports n-dimensional KDEs. Please see examples below for details. The implementation is already fairly optimized from a symbolic standpoint and is based on work by:
Sudderth, Erik B.; Ihler, Alexander, et al. "Nonparametric belief propagation." Communications of the ACM 53.10 (2010): 95-103.
In Julia 1.0 and above:
] add KernelDensityEstimateThe plotting functions for this library have been separated into KernelDensityEstimatePlotting.jl. Plotting functionality uses Gadfly. Comments welcome.
Bring the module into the workspace
using KernelDensityEstimate
# Basic one dimensional examples
# using leave-one-out likelihood cross validation for bandwidth estimation
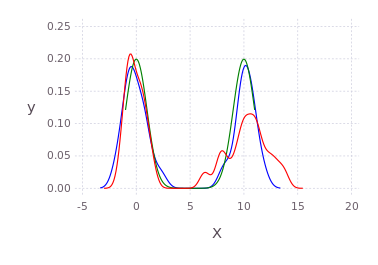
p100 = kde!([randn(50);10.0.+2*randn(50)])
p2 = kde!([0.0;10.0],[1.0]) # multibandwidth still to be added
p75 = resample(p2,75)

# bring in the plotting functions
using KernelDensityEstimatePlotting
plot([p100;p2;p75],c=["red";"green";"blue"]) # using Gadfly under the hood
Multidimensional example
pd2 = kde!(randn(3,100));
@time pd2 = kde!(randn(3,100)); # defaults to loocv
pm12 = marginal(pd2,[1;2]);
pm2 = marginal(pm12,[2]);
plot(pm2);
Multiscale Gibbs product approximation example
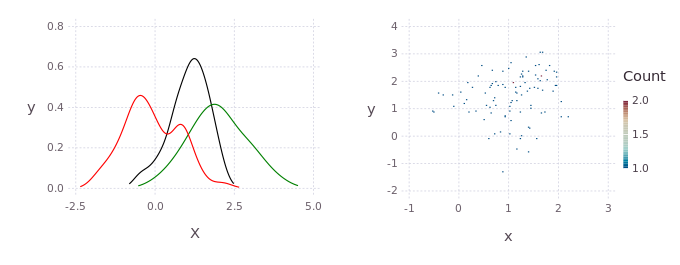
p = kde!(randn(2,100))
q = kde!(2.0.+randn(2,100))
dummy = kde!(rand(2,100),[1.0]);
mcmciters = 5
pGM, = prodAppxMSGibbsS(dummy, [p;q], nothing, nothing, Niter=mcmciters)
pq = kde!(pGM)
pq1 = marginal(pq,[1])
Pl1 = plot([marginal(p,[1]);marginal(q,[1]);marginal(pq,[1])],c=["red";"green";"black"])
Direct histogram of points from the product
using Gadfly
Pl2 = Gadfly.plot(x=pGM[1,:],y=pGM[2,:],Geom.histogram2d);
draw(PDF("product.pdf",15cm,8cm),hstack(Pl1,Pl2))
KDE product between non-gaussian distributions
using Distributions
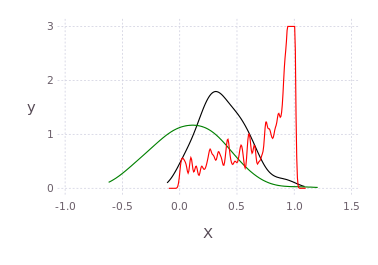
p = kde!(rand(Beta(1.0,0.45),300));
q = kde!(rand(Rayleigh(0.5),100).-0.5);
dummy = kde!(rand(1,100),[1.0]);
pGM, = prodAppxMSGibbsS(dummy, [p;q], nothing, nothing, Niter=5)
pq = kde!(pGM)
plot([p;q;pq],c=["red";"green";"black"])
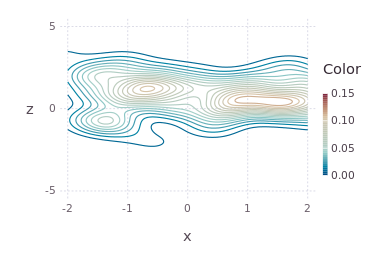
Draw multidimensional distributions as marginalized 2D contour plots
axis=[[-5.0;5]';[-2.0;2.0]';[-10.0;10]';[-5.0;5]']
draw(PDF("test.pdf",30cm,20cm),
 plot( kde!(randn(4,200)) ) )

N=200;
pts = [2*randn(1,N).+3;
 [2*randn(1,round(Int,N/2))'.+3.0;2*randn(1,round(Int,N/2))'.-3.0]';
 2*randn(2,N).+3];
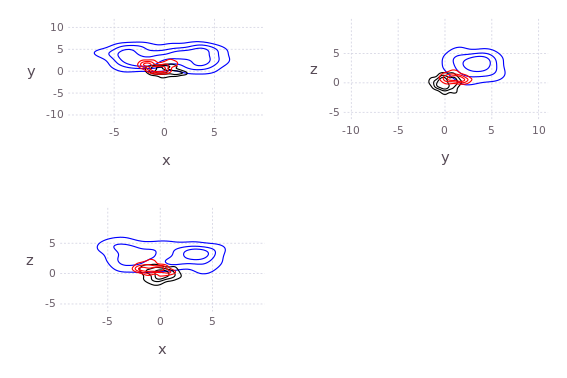
p, q = kde!(randn(4,100)), kde!(pts);
draw(PNG("MultidimPlot.png",15cm,10cm),
 plot( [p*q;p;q],c=["red";"black";"blue"], axis=axis, dims=2:4,dimLbls=["w";"x";"y";"z"], levels=4) )
# or draw product natively
draw(PNG("MultidimPlotProd.png",10cm,7cm),
plot( p*q, axis=axis, dims=[2;4],dimLbls=["w";"x";"y";"z"]) )The original C++ kde package was written by Alex Ihler and Mike Mandel in 2003, and has be rewritten in Julia and continuously modified by Dehann Fourie since.
Thank you to contributors and users alike, comments and improvements welcome according to JuliaLang and JuliaRobotics standards.
