![]()
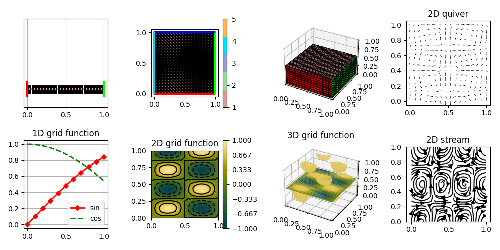
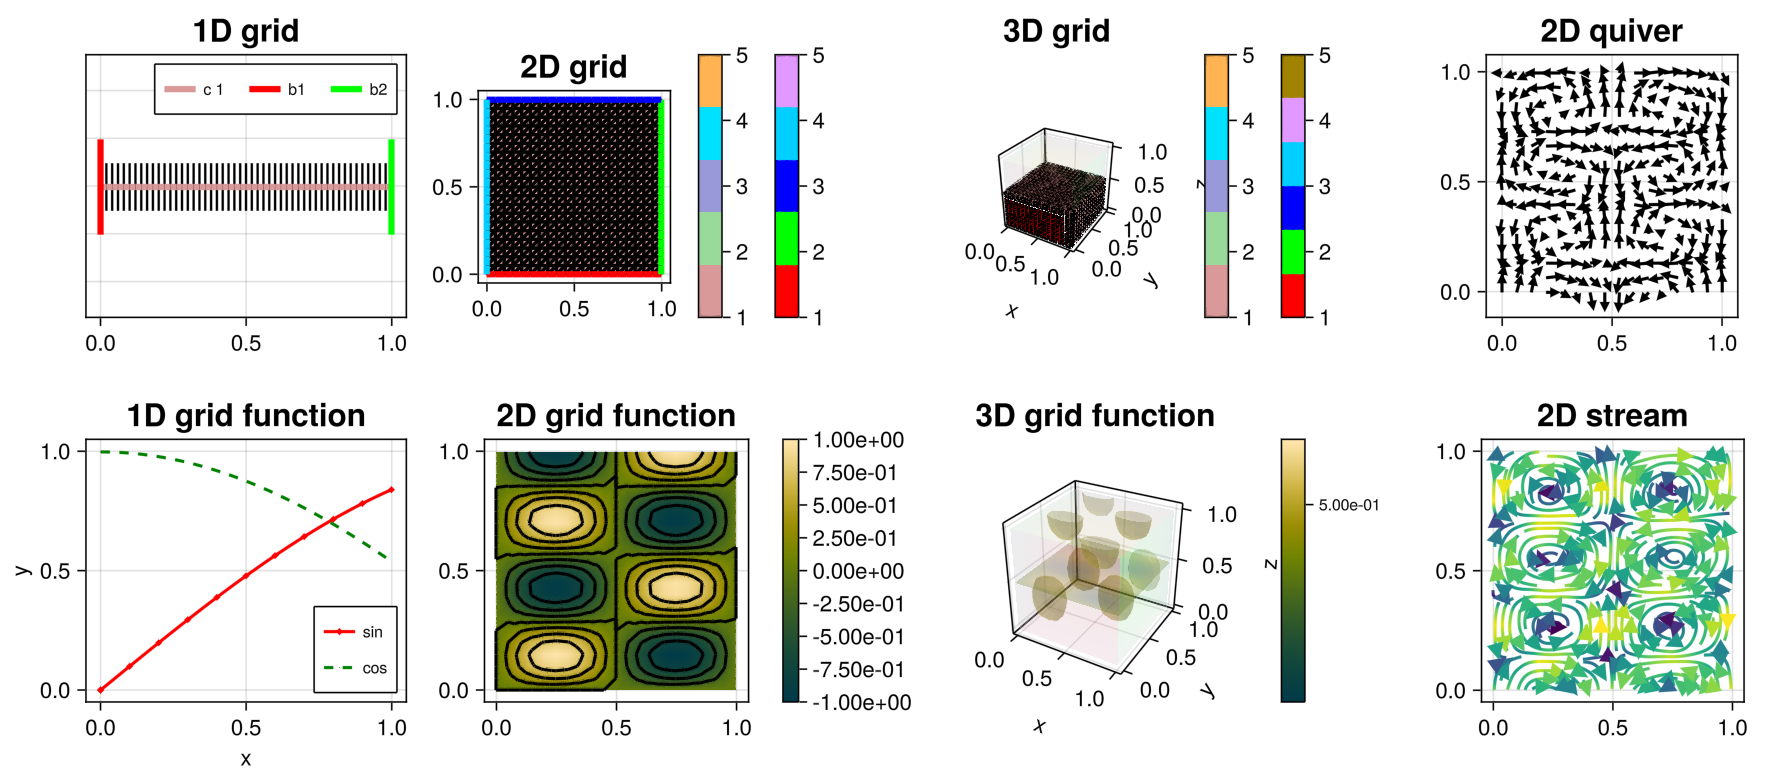
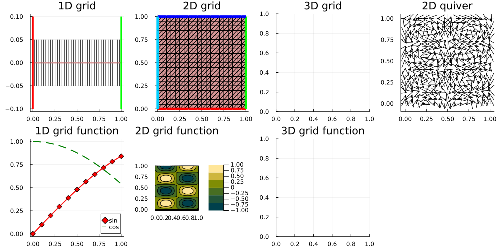
Plotting companion module for ExtendableGrids.jl Provides plotting of grids, scalar piecewise linear functions and vectors (2D only) for various plotting backends on simplicial grids in one, two or three space dimensions. The main supported backends are CairoMakie, GLMakie, PyPlot, and PlutoVista. Plots is only partially supported (1D and 2D rectangular grids).
The code is rather complex and many codepaths are hard to test. Please be prepared to help fixing things.
gridplot(grid, Plotter=GLMakie)
scalarplot(grid, function,Plotter=GLMakie)
vectorplot(grid, vectorfunction,Plotter=GLMakie)
streamplot(grid, vectorfunction,Plotter=GLMakie)
This works for 1/2/3D grids and either a function represented by its values on the nodes of the grid, or a scalar function of 1, 2 or 3 variables, respectively. Vector and stream plots are currenly available for 2D only.
Plot appearance can be tweaked by a number of keyword arguments.
Plotters can be e.g. Plots, PyPlot, GLMakie, CairoMakie PlutoVista - we pass the module exported by the package. Different plotters can be used at the same time.
vis=GridVisualizer(Plotter=GLMakie, layout=(1,2))
gridplot!(vis[1,1],grid)
scalarplot!(vis[1,2],grid,function)
reveal(vis)
This using fast updating via observables for GLMakie and persistent divs with PlutoVista.
vis=GridVisualizer(Plotter=GLMakie)
for i=1:N
   function=calculate(i)
   scalarplot!(vis,grid,function)
   reveal(vis)
end
Currently, these can be recorded with GLMakie, CairoMakie and Plots backends both from the REPL and Pluto notebooks. MP4 files and gifs can be created. PyPlot possibly will follow.
This shows the animated graphic in the REPL (essentially the same as above) and creates an embedded video in a Pluto notebook:
vis=GridVisualizer(Plotter=Plots)
movie(vis) do vis
  for i=1:N
     function=calculate(i)
     scalarplot!(vis,grid,function)
     reveal(vis)
  end
end
To save to a file instead of showing in a notebooks or from the REPL , use:
vis=GridVisualizer(Plotter=CairoMakie)
movie(vis, file="video.mp4") do vis
  for i=1:N
     function=calculate(i)
     scalarplot!(vis,grid,function)
     reveal(vis)
  end
end
Instead of specifying a Plotter in calls to GridVisualizer,
gridplot or scalarplot, a default plotter can be set:
default_plotter!(PyPlot)
gridplot(grid)
scalarplot(grid, function)
or
default_plotter!(GLMakie)
vis=GridVisualizer(layout=(1,2))
gridplot!(vis[1,1],grid)
scalarplot!(vis[1,2],grid,function)
Just pass Plotter=nothing in the respective places, or set default_plotter!(nothing)
and all plotting functions will do nothing.
- 'y': available
- 'i': some level of interactive control
- '(y)': availability only on rectangular grids
- 'p': planned (no schedule though)
- 'n': probably not, also in the future
| PyPlot | Makie | PlutoVista | Plots | VTKView | |
|---|---|---|---|---|---|
| scalarplot, 1D | y | y | y,i | y | y |
| vectorplot, 1D | y | y | y | y | y |
| gridplot, 1D | y | y | y | y | |
| scalarplot, 2D | y | y | y | (y) | y,i |
| vectorplot, 2D | y | y | y | y | |
| streamplot, 2D | y | y | p | n | |
| gridplot, 2D | y | y,i | y | (y) | y,i |
| scalarplot, 3D | y | y,i | y,i | n | y,i |
| gridplot, 3D | y | y,i | y,i | n | y,i |
| vectorplot, 3D | p | p | p | n | |
| streamplot, 3D | p | p | n | ||
| movie | n | y | n | y |

Plotting into the plot pane of Visual Studio Code is working. Here, you can use CairoMakie or WGLMakie as backend. This works only with the mutating functions, i.e. you should use something like
vis=GridVisualizer(Plotter=WGLMakie)
gridplot!(vis,grid,clear=true,show=true)
Plotting in Pluto notebooks for CairoMakie, PyPlot, Plots, GLMakie is working, WGLMakie probably works in combination with JSServe.
Plotting in Pluto notebooks can use PlutoVista.jl based on plotly.js (1D) and vtk.js (2/3D). See the example notebook: pluto, html.
Chances are that things work with Jupyter as well. Please ping me if you would like to volunteer with testing and possibly fixing this.